statsmodels.graphics.regressionplots.plot_ccpr_grid
-
statsmodels.graphics.regressionplots.plot_ccpr_grid(results, exog_idx=None, grid=None, fig=None)[source]¶ Generate CCPR plots against a set of regressors, plot in a grid.
Generates a grid of CCPR (component and component-plus-residual) plots.
- Parameters
- results
resultinstance uses exog and params of the result instance
- exog_idx
Noneorlistofint (column) indices of the exog used in the plot
- grid
Noneortupleofint(nrows,ncols) If grid is given, then it is used for the arrangement of the subplots. If grid is None, then ncol is one, if there are only 2 subplots, and the number of columns is two otherwise.
- fig
Figure,optional If given, this figure is simply returned. Otherwise a new figure is created.
- results
- Returns
- fig
Figure If ax is None, the created figure. Otherwise the figure to which ax is connected.
- fig
See also
plot_ccprCreates CCPR plot for a single regressor.
Notes
Partial residual plots are formed as:
Res + Betahat(i)*Xi versus Xi
and CCPR adds:
Betahat(i)*Xi versus Xi
References
See http://www.itl.nist.gov/div898/software/dataplot/refman1/auxillar/ccpr.htm
Examples
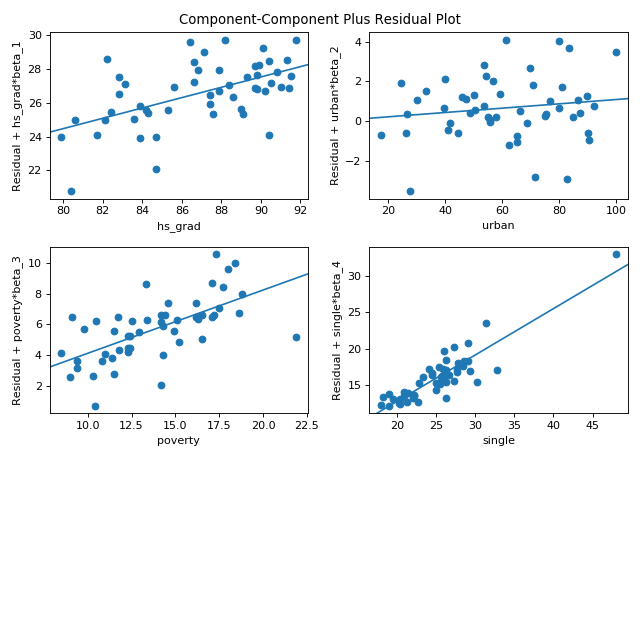
Using the state crime dataset separately plot the effect of the each variable on the on the outcome, murder rate while accounting for the effect of all other variables in the model.
>>> import statsmodels.api as sm
>>> import matplotlib.pyplot as plt
>>> import statsmodels.formula.api as smf
>>> fig = plt.figure(figsize=(8, 8))
>>> crime_data = sm.datasets.statecrime.load_pandas()
>>> results = smf.ols('murder ~ hs_grad + urban + poverty + single',
...                   data=crime_data.data).fit()
>>> sm.graphics.plot_ccpr_grid(results, fig=fig)
>>> plt.show()
(Source code, png, hires.png, pdf)